Sales Reports: Activity
What information does the activity report show?
The Activity Report allows you to analyze customer behavior and business performance in detail, segmented by day and hourly time slots. Here's what each indicator means and how to use it:
Total Tabs
Shows the number of opened accounts per hour, from 12:00 to 23:00.
Use this data to identify your peak activity hours, when most orders or service actions occur.
Total
Displays the total revenue generated by accounts in each time slot.
The background color intensity varies:
- Darker shades = Higher sales volume
- Lighter shades = Lower income
Tip: The more intense the background color, the higher the revenue for that time slot.
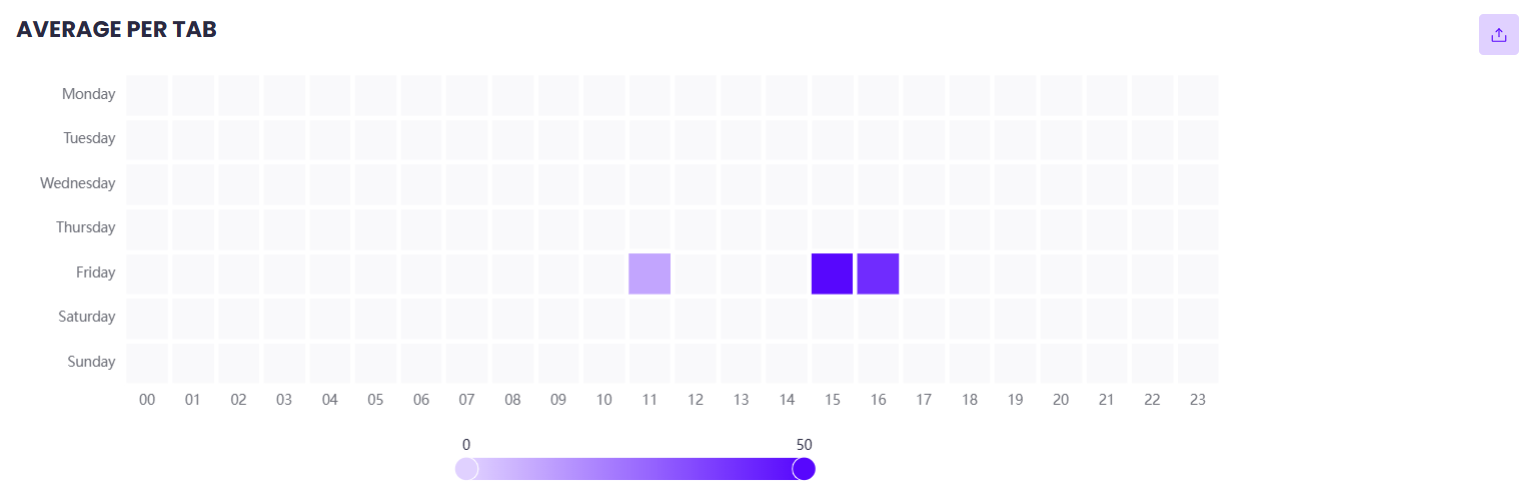
Average per Tab
Calculates the average ticket size by dividing the total revenue by the number of accounts during that time slot.
This helps you understand how much each guest spends on average, hour by hour.
Tabs Duration
Indicates the average time accounts remained open in each hourly segment.
Use this to detect if accounts stay open too long—this could indicate:
- Operational delays
- Slow table turnover
- Service inefficiencies
Why it matters
With this report, you can:
- Identify peak sales hours to make informed staffing decisions
- Optimize kitchen and service operations during high-load periods
- Improve table rotation and service speed
- Boost operational efficiency across your business
Related Articles
Sales Reports: Fraud Control
The Fraud Control Report helps you detect unusual transactions and prevent internal fraud or operational errors. It allows you to identify actions such as deleted invoices or removed products during service, giving you detailed control over your ...Reports: Structure of the Reports
Structure of the Reports In the Reports section of Last.app, you'll find detailed and organized information about your restaurant's performance. Here's how the reports are structured: Sales Billing: Displays total revenue with a detailed breakdown of ...Performance Reports: Employees
The Employees Report helps you evaluate the individual performance of each team member, focusing on productivity and sales generated. It's a powerful tool for making informed decisions regarding training, incentives, or operational adjustments. ...Sales Reports: Revenue Sources
The report of Revenue Sources allows you to analyze your business income by brand and sales channel. Learn how to apply filters and understand your revenue breakdown. Filters This section is common to all sales reports and includes two key buttons: ...Sales Reports: Billing Report
Billing Report The Billing Report in Last.app gathers all the essential information to understand how much your restaurant earns over a selected period of time. This article explains each section in detail. What is it for? Internal control: Monitor ...
Popular Articles
Getting Started: Muting LastPOS
When a new order is received in LastPOS, the primary device (the "Master") emits a sound to notify staff. If you'd like to mute the system, you can easily do so by following these steps: How to Mute LastPOS Open the side menu by tapping the ...Integrations: FreshKDS
How to integrate FreshKDS with Last.app The integration between Last.app and FreshKDS allows you to automatically send kitchen items from your POS to KDS (Kitchen Display System) devices, optimizing kitchen operations and improving communication ...Getting Started: Enable or Disable Products and Modifiers from the POS
Enable or Disable Products and Modifiers from the POS In Last.app, you can easily enable or disable a product or modifier directly from the POS. The change will automatically apply across your POS system, delivery platforms, and online store — all at ...Getting Started: The Structure of LastPOS
The Structure of LastPOS LastPOS is the platform that enables end-to-end management of any food service establishment. It is built around two main components: POS (Point of Sale): The core system for managing in-house and takeaway operations. ...Getting Started: Table Functions
How to Manage Your Tables From the table layout view, you have several options to manage your tables. In this article, we’ll walk you through the table management menu and the view options menu. Table Management When you select a table, you can ...